
The Puzzle of Low Data Center Utilization Rates
Contrary to popular belief, data centers aren't maxed out around the clock - and this has real consequences for power system planning

One of the biggest puzzles I’ve encountered in the data center space is this: why do data centers appear to operate at lower utilization rates than so many people think?
Today, I presented on a webinar hosted by the National Association of State Energy Officials (NASEO) and the National Association of Regulatory Utility Commissioners (NARUC) on data center electricity demand and flexible load integration. As part of my presentation, I shared slides that I recently created to address what appears to be a significant gap between belief and reality on this topic.
There’s a widespread perception that data centers operate 24/7/365 at near-maximum demand, consuming electricity at a constant clip with little variability. That perception can drive utility planning, investment, and regulatory decisions. For example:
Duke Energy, 2024 testimony to the NC Utilities Commission: "[Data centers] are operating at a consistent load factor 365 days a year, seven days a week, 24 hours."
Resources for the Future, 2024: "They run very consistently. Let's say it has a 90 percent load factor."
ARES Wealth Management Solutions, 2024: "Data center capacity calculated assuming a 90% load factor."
Energy Futures Group, 2025: "A large load data center, since it is constantly active, will have a high load factor of 90-100%."
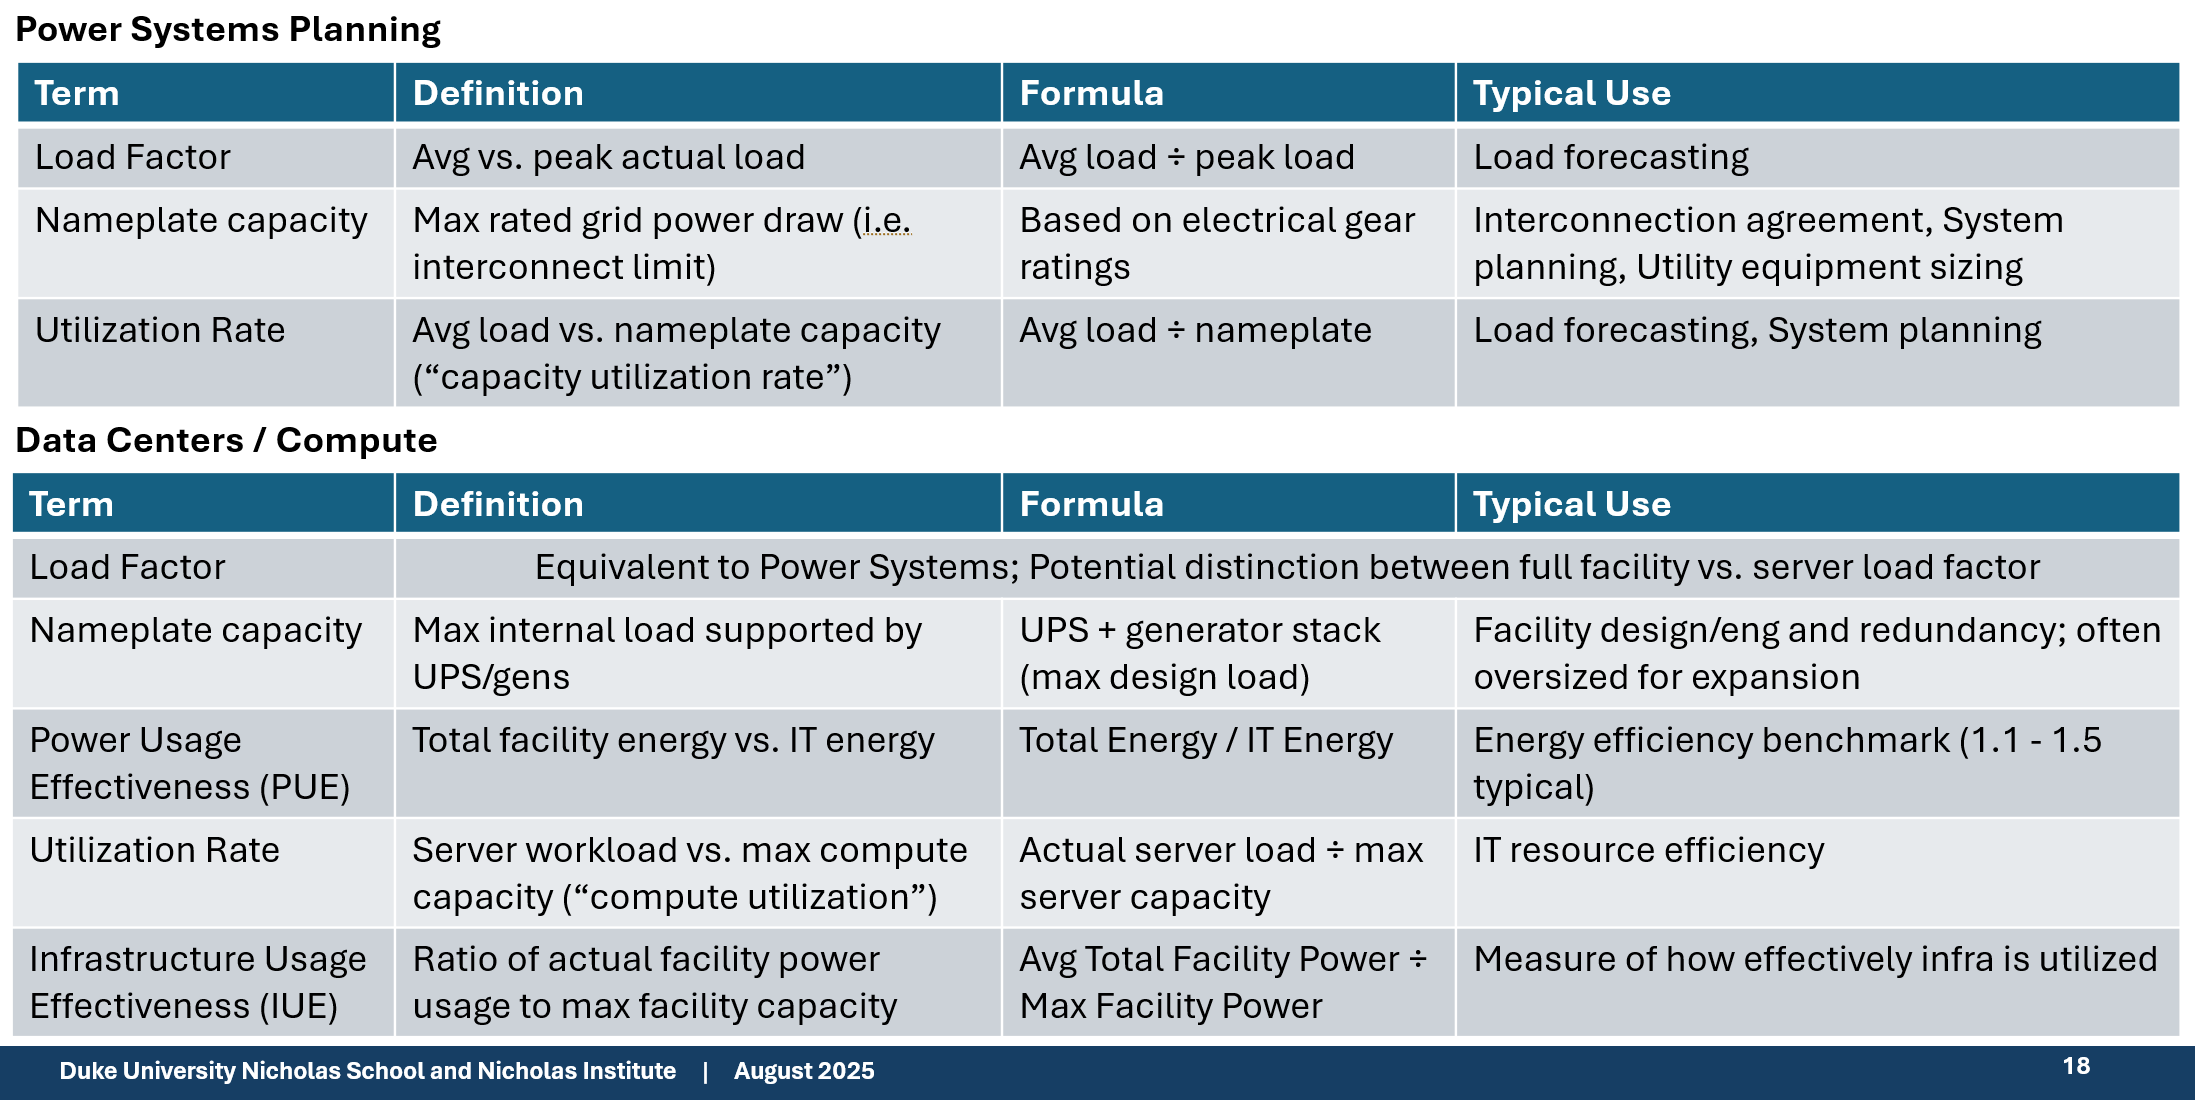
But this framing blends together distinct metrics — like load factor, capacity utilization, and uptime — that measure very different things. In doing so, it can make data center power demand appear more constant and closer to full capacity than it actually is. As a starting point, it’s critical to distinguish between load factor and capacity utilization rate (see Table 1).
Table 1: Terminology for Data Center Power Systems Planning
Untangling Load Factor, Utilization, and Uptime
Here are a few common points of confusion:
Load Factor ≠ Utilization Rate. Load factor is the ratio of average demand to realized peak demand. But if a facility’s realized peak demand is only 80% of that facility’s rated capacity, and its load factor is 90%, then its true capacity utilization rate is only 72%.
Load Factor ≠ Server Uptime. A facility with high electrical load factor may still have servers operating well below their compute capacity.
Server Uptime ≠ "Five Nines" Uptime. The industry standard uptime guarantee (99.999%) is about customer-facing availability, not actual server utilization.
Non-IT Load Variability Matters. Cooling and other infrastructure loads fluctuate and contribute to apparent consistency, masking underlying variation in IT load.
PUE ≠ IUE. The predominant energy-related metric reported by the data century industry is Power Usage Effectiveness (PUE), but unfortunately, PUE indicates nothing about a given facility’s capacity utilization rate, which in the data center industry is sometimes called “Infrastructure Usage Effectiveness (IUE).”
These nuances matter, because they affect how we plan for data center power needs, how we size infrastructure, and how we assess the potential for flexible demand. As just one example, if you’re a utility regulator and your utility says it anticipates a new 500 MW data center will be interconnected in the next year, the only way to calculate that data center’s expected annual electricity consumption is if you know its expected capacity utilization rate (i.e., annual electricity consumption = annual capacity utilization rate * nameplate MW rating * 8760).
What the Data Say (and Don’t Say)
As Lawrence Berkeley National Lab noted in its 2024 U.S. Data Center Energy Usage Report:
The lack of primary performance and utilization data indicates that much greater transparency is needed around data centers. Very few companies report actual data center electricity use and virtually none report it in context of IT characteristics such as compute capacities, average system configurations, and workload types.
One of the few figures in the report that attempts to quantify utilization shows operational time for servers broken down by data center type — a rare attempt to characterize real-world data center operations (see Figure 1). But even this is only a proxy, not a true measure of capacity utilization.
Figure 1: Operational time of servers given data center type
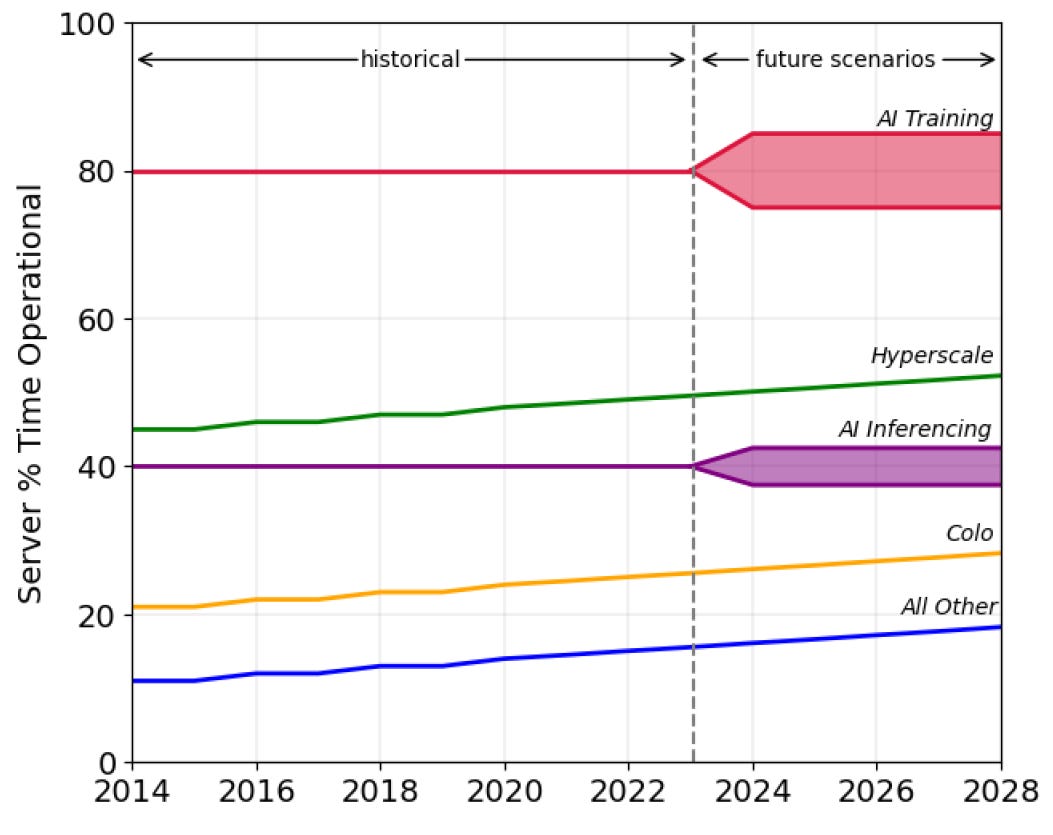
Source: Shehabi, A., et al. 2024 United States Data Center Energy Usage Report. Lawrence Berkeley National Laboratory, Berkeley, California. LBNL-2001637
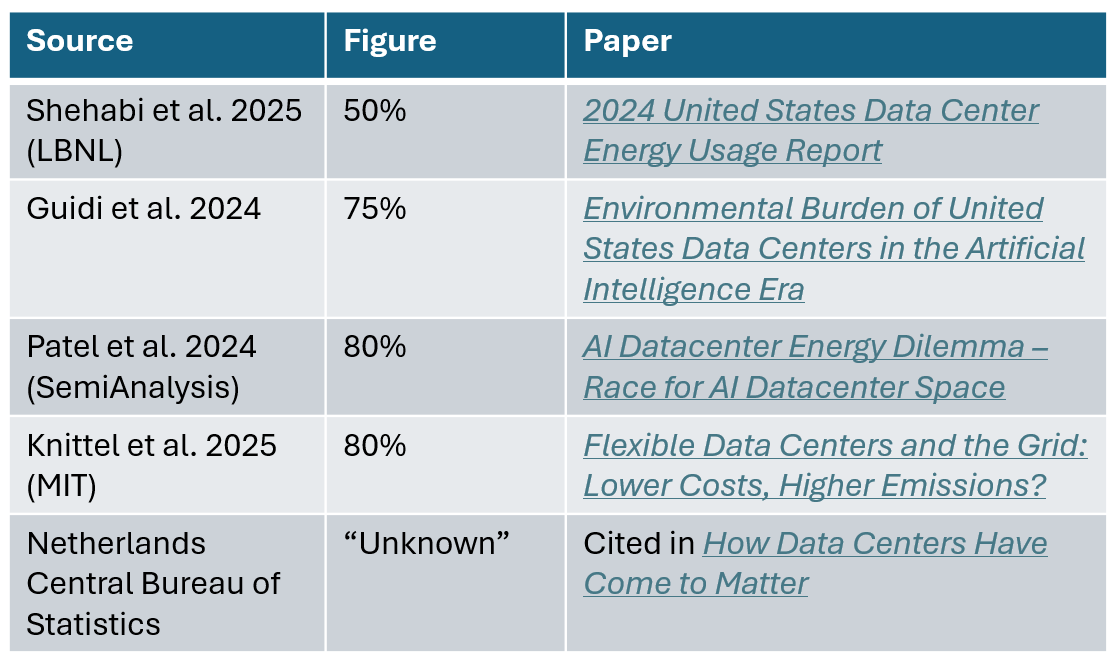
In the absence of clear public data, estimates vary widely (see Table 2). Some sources reference load factor; others conflate it with utilization or uptime. And as I’ve found, if you ask 10 people to explain data center capacity utilization rates, you’ll get 10 slightly different answers.
Table 2: Data Center Average Capacity Utilization Rate Assumption
Why Might Utilization Be Lower Than Expected?
There are several potential explanations for why data centers, including those supporting AI workloads, may operate well below maximum utilization. These factors highlight the operational realities that challenge the "always-maxed" myth:
Maintenance and Redundancy. Many facilities are overbuilt to ensure uptime, with servers periodically taken offline for routine maintenance, software upgrades, or hardware replacements. Redundancy (e.g., backup systems or spare capacity) means not all resources are active simultaneously, creating built-in underutilization to prevent single points of failure.
Nameplate ≠ Real-World Usage. The “nameplate” power rating of a chip, often based on its thermal design power (TDP), reflects the maximum theoretical power it could draw under extreme, fully saturated workloads. These ratings are used to inform the electrical system design, but in practice, chips rarely operate near those levels. Reaching 100% of nameplate power across an entire rack or cluster is not only unusual, it's extremely difficult to sustain, and often not desirable given reliability and thermal constraints.
Inconsistent Workloads. Not every program or task in a data center demands full processing power around the clock. Usage levels vary based on factors like who the customers are, where they're located, the time of day, and the specific type of work being done. For instance, AI training may maintain a steady but occasionally bursty pattern at 80% server utilization, while AI inference (handling real-time user requests, like chatbots) may frequently drop to 40-60% due to fluctuating demand.
Oversizing and Ramp-Up. Data centers may request and design for power capacity well above their expected near-term needs to maintain flexibility for adding servers or accommodating future workloads without waiting for another interconnection process. In practice, new facilities often operate well below designed capacity during the initial ramp-up period as additional servers are installed and workloads increase, sometimes for extended periods.
Hardware Fragility at Scale. Hyperscale AI training clusters push GPUs to their physical limits, and fault rates rise accordingly. During a 54-day training of Meta’s Llama 3 405B model, using up to 16,000 NVIDIA H100 GPUs, Meta reported 466 job interruptions, with nearly 80% linked to hardware faults. GPU issues were the most common, including thermal stress and memory failure. Industry analyses suggest this could equate to an annualized GPU failure rate of ~9%, with cumulative risk exceeding 25% over three years. In large clusters, even a 1% failure rate can mean dozens of issues per day.
Synchronous Sensitivity. In AI training processes that require all GPUs to work in perfect coordination, a failure in even one GPU can halt the entire operation, forcing a restart. Some companies employ diagnostic tools to quickly identify and address these issues, reducing overall downtime, but nevertheless the ripple effects from a single hardware glitch can still significantly disrupt cluster-wide performance and reduce average utilization.
Toward Better Data and Evidence-Based Planning
Understanding how data centers actually operate — including how much and when their capacity can be expected to be utilized — is foundational to how we plan our electricity infrastructure. Misunderstanding utilization rates and load shapes can lead to overbuilding and unnecessary investment, which ultimately raises costs for everyone (see: “Data Centers Could Make or Break Electricity Affordability”).
In fairness, not even the most sophisticated data center owner-operators necessarily know what their utilization rates and load shapes will look like in the face of uncertain market demand for AI services and a rapidly shifting competitive landscape. Amid such uncertainty, their preference is generally to maintain maximal optionality — overprovisioning capacity to handle potential surges or pivots. While this is an understandable commercial strategy, the practical result is that it contributes to power system overbuild, which is especially concerning to the extent that any costs are socialized to other ratepayers. Even if they're not, allocating scarce utility resources to support this headroom can divert them from other system needs, like reliability upgrades and proactive transmission expansion.
We’re still flying partly blind, and until we improve transparency — whether through benchmarking programs, voluntary reporting, PUC requirements, or academic-industry partnerships — policymakers and planners will be left to make consequential decisions based on assumptions rather than evidence.
##
Hi Tyler.
Have you given thought to what a minimal legislative requirement for data center/AI accountability would be? The European Union has set some standards. Voluntary standards or relying on individual PUCs seem not to get us very far. Please reply.
Thanks.
Dan Chandler (I'm signed up for this substack so you have my email).
Sharing with the SACE team. I hope the NCUC asks you to address the large load conference in October. It makes total sense. Just like the gas CC fleet doesn’t really operate 100% 24/7, and yet utilities are locking up expensive firm transportation on new pipeline expansions as if they do.